Estimating Space Heating and Domestic Hot Water Costs--
For a ground source heat pump equipped home (not yet completed)
Scroll further down this page to see the high monthly winter (total electric) bill predicted as $161
|
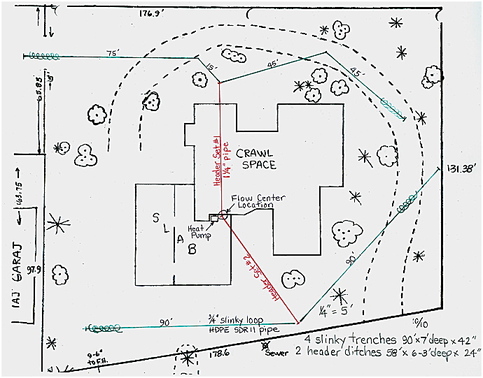
Ground loop plan for a 3,265 sf home in Quincy, CA
|
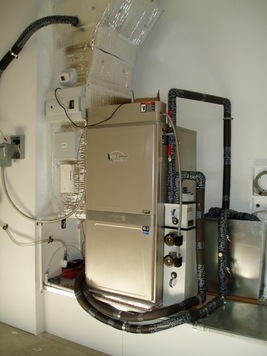
The plan view (at left) represents a home whose construction commenced in spring, 2012. The following page incorporates estimated performance data for a ground source heat pump system to be used in this home for space heating, cooling, and water heating. It attempts to establish total operating costs for the 3,265 sf home in a 5,852 degree day climate at 3,500' in the northern Sierra Nevada of California. |
--------------------------------------------------------------------------------------------------------------
Data Sources and Dependability--
The estimates below are built upon what is called "binned" temperature data for a specific location. The nearest, similar climate that has generated this kind of data is Reno, Nevada, 75 road miles to the southeast of Quincy. Such data breaks down temperatures by the mid-point between temperature ranges of five degrees, from as hot as it's ever been in that location to as cold as it's ever been. In addition, such records illustrate when such temperatures occur within three eight hour periods: 12-8am, 8am-4pm, and 4pm-12am.
The estimates below are built upon what is called "binned" temperature data for a specific location. The nearest, similar climate that has generated this kind of data is Reno, Nevada, 75 road miles to the southeast of Quincy. Such data breaks down temperatures by the mid-point between temperature ranges of five degrees, from as hot as it's ever been in that location to as cold as it's ever been. In addition, such records illustrate when such temperatures occur within three eight hour periods: 12-8am, 8am-4pm, and 4pm-12am.
|
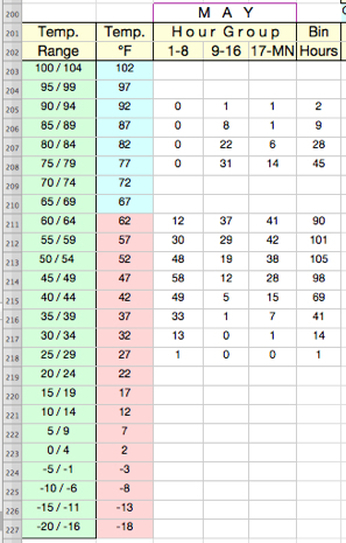
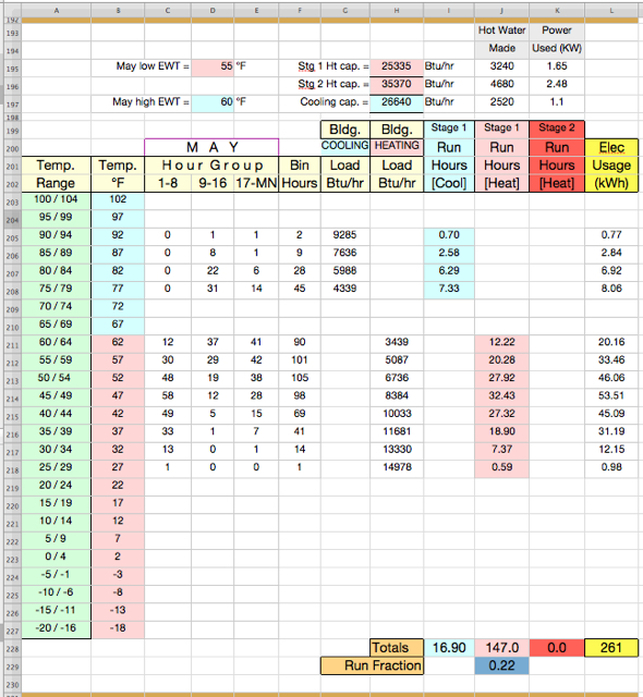
(Left) "Binned" temperature data from the National Oceanic and Atmospheric Administration (NOAA) for Reno, NV placed into a working spreadsheet built by your Webmaster.
The blue/red column assumes at such temperatures there will be either heating or cooling required to maintain desired indoor temperatures. Normally, at least a five degree "dead band" exists near 65°, since outdoor temps of this level usually wouldn't require supplemental heating or cooling. Internal heat loads of refrigeration, lighting, people, and appliances are enough to raise internal temperatures for comfort. Good insulation and a ventilated attic make cooling unnecessary until temperatures climb higher, depending on humidity levels. In this illustration, the dead band has been expanded to 10 degrees because the subject house has R-49 ceilings, R-30 walls, R-30 floors, and very good windows. As a climatic example, row 211 shows the total hours in three time periods when May temperatures average 62°. They are 12hrs, 37hrs, and 41hrs. Together, these "bins" add up to 90 hours of 62 degree outdoor air temperature for the month. Notice that the bin with the highest number of hours that month is 105, representing a temperature of 52°F. |
Two Approaches--
FIRST APPROACH TO USE PREDICTION AND COST:
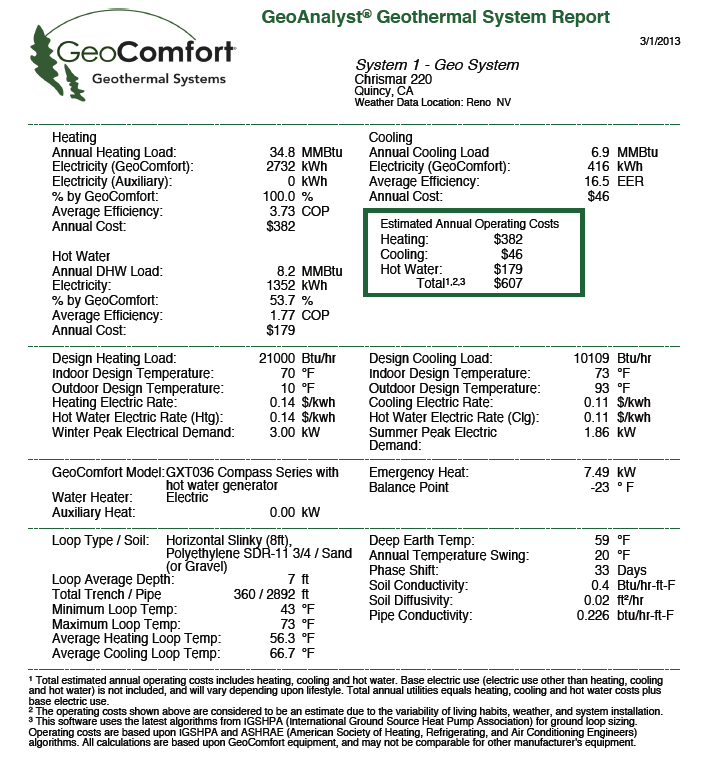
Use of binned temperature data from Reno was used in two different ways for this house. Ground source engineering software called GeoAnalyst® from Enertech Manufacturing predicted the yearly heating, cooling, and hot water expense using their equipment. The results of heat pump performance testing are not secret (they're proudly displayed in marketing literature). But in this case, it is easier to use software for a specific brand and model heat pump, which was done for this Quincy house and its GeoComfort 3-ton unit. The performance data for all versions of this manufacturer's equipment are built into the software, as are the binned temperatures from hundreds of U.S. locations. The other critical item entered is your building's hourly heating and cooling load (Btu losses and gains at winter and summer design temperatures) and the number of occupants, so that hot water needs can be assessed.
The software user inputs desired inside temperatures and desired maximum and minimum ground loop temperatures that will supply the heat pump (called EWT, Entering Water Temperature), along with local electric utility rates. Head-to-head comparisons can also be made between one of Enertech's ground source heat pumps and any other heating system such as a furnace powered by oil, gas, or propane; each with a separate air conditioner, keeping this an "apples-to-apples" comparison. This assumes that the user possesses installed price information for each system option. If not, the major content of the report from this software will be limited to operating cost (only) for heating, cooling, and domestic hot water; nothing to do with return on investment, payback, or other common financial metrics. There is also an estimate of winter and summer peak electric demand for the system. [This is of interest to electric utilities, since a ground source heat pump uses much less power on a hot day than a conventional air conditioner, or on any day compared to an air-to-air heat pump.]
|
(Right) Computer software is the quickest way to get lots of detail and a firm estimate of three things making up this share of your utility bill. This report predicts a $607 yearly cost for heating, cooling, and hot water generation associated with this house and its occupants. When trying to estimate partial energy use, this information is the most accurate we have because no two families have the same base load representing the rest of their electrical use. Cooking, lighting, refrigeration, and other living habits affect the base load not covered in the report to the right. |
When software like this calculates, it churns away on computer formulas and special algorithms that represent the binned data previously shown and the seasonal dynamics of temperature change in the ground, and in the outside and inside air. An illustration of some of these elements in dynamic opposition is shown below, for an Intermountain residence with a heat pump that does very well in a cold climate.
|
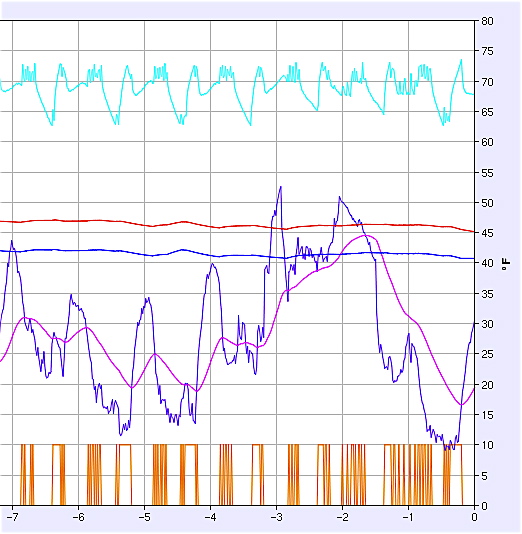
(Right) A ground source heat pump installation in the Salt Lake Valley, Utah for a week's time shows a variety of temperature data: Turquoise = IAT (indoor air temperature)
Red = EWT (entering ground loop temperature) Light Blue = LWT (leaving ground loop temperature) Hard Blue = OAT (outdoor air temperature) Purple = Outdoor running average temperature Orange = Heat pump "on" time run cycles |
A week's data from the Salt Lake Valley ending 1/17/12
helps illustrate the difference between extreme lows and highs and the average temperature for a 24-hour period. |
SECOND APPROACH TO USE PREDICTION AND COST:
Another way to predict energy use and cost is to use a home-built spreadsheet application. Binned temperature data can be inserted, electrical base load can be estimated or incorporated from previous family utility records, and a heat pump's performance data can be used. The result of the spreadsheet's calculation reveals the percentage of time that the equipment will work, attempting to heat or cool. And if it sports a feature called a de-superheater, such a unit will pre-heat hot water while it heats or cools, so the spreadsheet will produce cost results for that, too.
Most contemporary ground source heat pumps contain two-speed compressors that deliver 67 and 100 percent of their capacity. This is referred to as Stage 1 or Stage 2 operation. Because of knowing the number of hours a heat pump will have to run to overcome the load represented by the binned temperature data, we have an idea whether it will run at low or high capacity, and what its runtime and electrical consumption will be in hours. What follows is the May section of such a spreadsheet. Below that is a collection of all 12 months operations for the subject Quincy, CA house.
The capacity of the heat pump in Stage 1 or Stage 2 heating or cooling depends on the temperature of the ground loop water entering the heat pump in cells D195 and D197. Working at full capacity, the heat pump simply pulls more Btus from the same circulating water (H195 & H196). In vertical bore loop fields (often 200-foot depth), the swing in yearly temperatures is almost non-existent because everything below a depth of 20 feet does not change with the season. Not so a trenched horizontal loop nearer the surface of the ground. It can vary 15 or 20 degrees from seasonal high to low.
You may have noticed cell H197 in with a blue backing. This is the capacity in Stage 1 for cooling. Stage 2 cooling is certainly possible for this unit. But this home (in this climate) will never use it. We call it an "unbalanced" climate; where the Btu load in heating and cooling are unequal. This installation is in a heating-dominated climate. We size the unit's capacity for the heating load, the larger of the two loads. The cooling load is so much smaller in this climate that the unit will never have to run in Stage 2 for cooling. If this home was located in Dallas, TX, the reverse would be true!
Note cells I228 and J228. The cooling hours are only 10% of the total runtime of 163.9 hours. And when the total runtime is compared to 744 total hours for the month of May, the runtime fraction becomes .22 in cell J229. This runtime fraction not only drives how many Btus we will move, but also the kilowatts (KW) of the electrical load. This KW figure (such as in cell K195) can be multiplied by 1,000 watts to tell us how many watts the unit consumes while it runs. And it is used directly in the calculation of (KW * run hours) to yield kilowatt-hours (the unit of electricity we pay for).
Twelve months of binned data, runtimes, and power consumption for this Quincy, CA home.
Click on any image below to enlarge it or once enlarged,
use your right arrow key to scroll laterally across each row of four
use your right arrow key to scroll laterally across each row of four
January February March April
May June July August
September October November December
Base Load--
When you've estimated heating, cooling, (and hot water as in the case of the GeoAnalyst® software's report, above) the remaining base load must be considered. This is the electrical energy used for lights, refrigeration, cooking, laundry, and all other appliances or tools. It can be a considerable amount, and sometimes, people's base loads are amazingly high compared to their heating/cooling.
In the case of this new Quincy house, a 15-year use record from the previously occupied house was bumped upward by 7.5% and placed in the spreadsheet's row 13 in the summary document below. The extra was cited because the footprint of the new house is larger, likely resulting in more lighted area, and because more supplemental HVAC equipment would be running part of the time: heat recovery ventilator (often), electronic air filter (whenever heat pump runs), and humidifier (in deep winter only).
In the case of this new Quincy house, a 15-year use record from the previously occupied house was bumped upward by 7.5% and placed in the spreadsheet's row 13 in the summary document below. The extra was cited because the footprint of the new house is larger, likely resulting in more lighted area, and because more supplemental HVAC equipment would be running part of the time: heat recovery ventilator (often), electronic air filter (whenever heat pump runs), and humidifier (in deep winter only).
Yearly Summary of Energy Use by Month--
After all the work represented above, this is the ESTIMATE of what the total, all-electric energy costs for heating, cooling will be for the subject new house in Quincy. All estimates remain just that, until the hindsight of a continuous string of utility bills shows us the reality. This is as close as your Webmaster can get to the truth prior to occupancy. After occupancy, utility bills will be posted here.
For those future bill postings, don't look for a perfect match of the month-to-month estimates below because the billing cycle for this house is more mid-month to mid-month. But the total billed cost per year will be a precise number to compare with Jan-thru-Dec below. Let's look more carefully at the summary.
For those future bill postings, don't look for a perfect match of the month-to-month estimates below because the billing cycle for this house is more mid-month to mid-month. But the total billed cost per year will be a precise number to compare with Jan-thru-Dec below. Let's look more carefully at the summary.
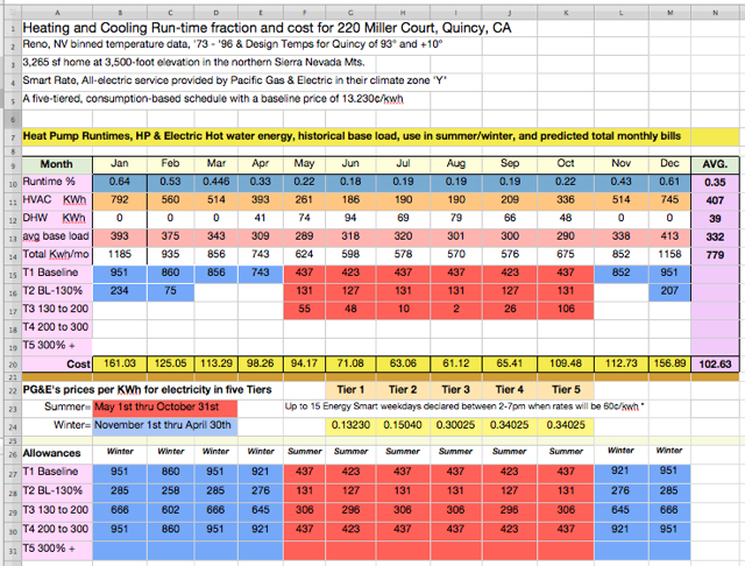
Row 10— Highest fraction (or percent) of heat pump running hours in January and the lowest in June. These fractions are the result of the number of hours the equipment will run due to the binned data predicting a heat loss or gain by the structure that causes the thermostat to activate heating or cooling. These hours in Stage 1, 2, or 3 are totaled and divided by the total hours in January (24 x 31 = 744) to result in this runtime fraction of all hours.
Row 12— The number of kilowatt hours of electrical resistance heating needed when the heat pump's de-superheater cannot generate enough to carry the total domestic hot water load for the month. This deficit happens in seven months per year. These "deficit kilowatt hours" are imported from in the Yearly Estimate of Hot Water graphic below.
Row 13— Average base load is imported from 15 years of existing home records and increased by 7.5%.
Row 14— Is the total of estimated kilowatt hours from rows 11, 12, and 13. The high is in January and the low is in August.
Rows
15 -thru- 19— Each of these is a Tier of useable kilowatt hours from the utility Pacific Gas & Electric. Baseline is the first and least expensive Tier shown in cell C24. Winter baseline use allowances are in blue and summer allowances are in red in the lower portion of the diagram in rows 27 -thru- 31.
Rows 15 -thru- 17 show the actual predicted use in each rate Tier per month. In May for example, of the 624 kWh used, 437 finishes off the baseline allowance. The next 131 consumes all of Tier 2. And there are 55 more kWh of use that lands in Tier 3 out of the 306 available there. Rows 18 & 19 are blank because no use lands there when the monthly total is 624 kWh. The winter baseline amounts based on 11/1 -thru- 4/30 are more generous and easier to meet. The electric challenge in California is the summer afternoon peak loads, so prices reflect this as an incentive to use at other times of day (or not at all).
Row 20— This is the total estimated monthly cost of all use. The average monthly billing is under $103.
Not Shown— If you perform the math on the illustrated numbers for Row 20, they will not match. That is because built into the spreadsheet formulas are the utility's incentives for this customer being on the E-RSMART rate plan. Anytime during the red season the utility can contact the customer the night before an Energy Smart Day is declared (up to 15 weekdays from 6/1 to 9/30). At 2pm to 7pm on such a day, the price per kWh will be 60¢.
The compensating incentives are that during 6/1 thru 9/30 of red season, a rate deduction (for all use NOT during an Energy Smart Day 2-to-7) will be reduced nearly 3¢/kwh in Tiers 1 & 2, and nearly 4¢ in Tiers 3, 4, and 5. The subject house in this case has the heat pump and all major appliances on timers so that they can be de-activated on Smart Day afternoons. This is another case where a great building envelope that requires little air conditioning will result in smaller (cheaper) equipment, and the ability to "coast" for five hours on a hot afternoon by pre-cooling a few degrees earlier in the day, if nothing else.
An Energy Smart Day will be a weekday were the predicted temperature in much of the utility's service area will be at or greater than 96°F. Therefore, one can be fairly certain when a notification is likely. There were 10 Energy Smart days declared in the summer of 2012.
Yearly Estimate of Domestic Hot Water Costs--
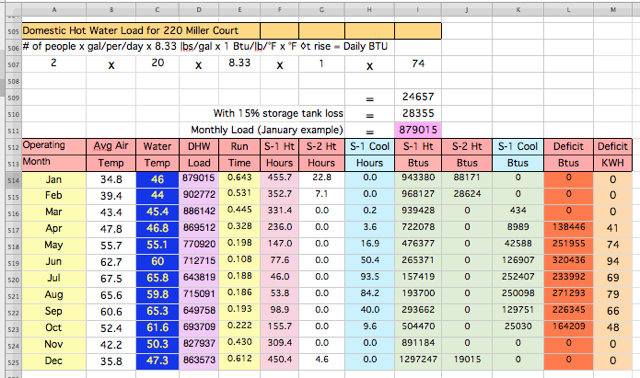
The greater the length of time that a de-superheater equipped ground source heat pump runs, the more water it will pre-heat. Looking at spreadsheet row 507 (below) you can see the standard formula for calculating hot water load. This row shows that two persons, times 20 gallons per day each, times 8.33 pounds of water per gallon, times 1 BTU to raise a pound of water upward 1°F, times the difference in temperature the water must be raised = the total daily Btus required. In this example for January's load, the water heater target is 120°, the incoming water is 46°, and the difference is 74°.
In the example below, the daily amount of heat has been increased by 15% to account for line and tank losses, and has been multiplied by the number of days in that month to achieve total monthly load. Column C represents the actual monthly water temperatures by a digital thermometer at the kitchen sink tap running for an extended period. The water utility's lines are between three and four feet underground and their supply comes from wells or two 1,000,000 gallon steel tanks in the area.
In the example below, the daily amount of heat has been increased by 15% to account for line and tank losses, and has been multiplied by the number of days in that month to achieve total monthly load. Column C represents the actual monthly water temperatures by a digital thermometer at the kitchen sink tap running for an extended period. The water utility's lines are between three and four feet underground and their supply comes from wells or two 1,000,000 gallon steel tanks in the area.
Reviewing the remainder of the columns across, let's begin with row 514 for January. Column B is a reference to outdoor average air temperature. It is not used in any calculation in this spreadsheet because it is already incorporated to the more specific bin hours of imported climatic data. Column D is the total monthly hot water load in Btus, matching the previous example in cell i511. Column E is the total runtime percentage for the heat pump (imported from another position on the spreadsheet) and is visible in the above binned chart for January at cell J73. It is also visible in the summary chart not far above as cell B10.
Column F is the total January runtime hours where the heat pump worked at Stage-1, 67% of capacity. Columns G and H provide the same kind of information for S-2 heating and S-1 cooling. There was Stage-2 heating operation in January but (obviously) no cooling. Columns I, J, and K each show the number of Btus that were generated in the various stages' running hours. The Btu values for hot water production are imported to these columns from another spreadsheet location and multiplied by the run hours values in columns F, G, or H. January hot water Btus come from the January bin chart (1 of 12 above) at cells J38-J40. Water heating S-1 Btus are 2,070 per running hour and water heating S-2 Btus are 3,870 per running hour. Both have been reduced for tank and circulation losses from their factory numbers.
Column L is the position where all heat pump hot water Btus were combined and compared against the total January load in column D. If the heat pump's production exceeds the hot water load, a zero was entered, as in cell L514. If not, the number of Btus in deficit of the load is entered. The first month in which this occurs is April in cell L517.
When there are deficit Btus in column L, they are divided by 3,413 (the number of Btus provided in a kilowatt hour of resistance electricity, as in an electric water heater) to register as a deficit KWH in column M. For April, the amount in cell M517 is 41. If you go to the summary graphic above, you'll find it entered in cell E12 as the amount of domestic hot water electricity that becomes part of April's total use and utility billing.
Total Winter Utility Bill Estimate for this home--
The intended energy supply for this home in Quincy, CA is electricity-only, and it will be supplied by Pacific Gas & Electric Company of San Francisco. Prices are on the high side compared to other regions of the nation. This utility has sophisticated tiered rates which allow seasonal baseline quantities based on microclimate and four pricing levels for increased consumption beyond the baseline allowance. They have offered time-of-day pricing for many years, and with newly installed smart metering, there is an expansion of these options.
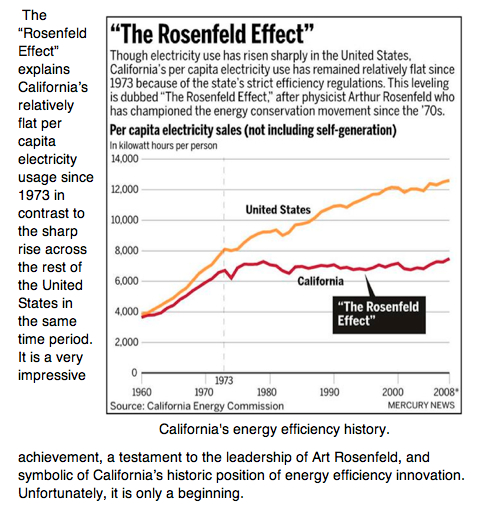
It can be said that with this pricing formula, deviance from conservation is costly, and this approach across California has worked. The state's per-capita electric consumption has remained flat for 30 years, while the rest of the nation's has grown by 50%. High Tier users in PG&E territory pay lots more for their average kilowatthour, and many of them are taking advantage of photovoltaic installations. There are smart (net) metering rate options available that help them dramatically reduce costs by reducing their consumption out of high-tier monthly quantities of kilowatthours.
The to-be-constructed home in this example will be considered "all electric," and under a winter baseline use allowance between 860 and 951 KWH per month between November 1 and April 30th. Though it might not correspond to anyone's calendar interpretation of winter, it is the utility's more generous half of the year for electricity baseline allowances. The summer all-electric baseline allowance is only 423 to 437 KWH per month for this home's location, reflective of California's peak load season.
|
(Right) California's flat per capita electricity demand compared to the rest of the U.S. A conservation ethic, long-range policies sensitive to energy use, and a rate pricing structure to discourage waste have paid off. Customers have saved because of better building and appliance standards, and everyone benefits without the need for massive increases in generating plants. |
After the build and occupation of this home, real evidence for how close or far this estimate is to reality will be known. If this estimate turned out to be seriously low, the owner would consider the option of a solar photovoltaic installation to get out of the higher tiers, both winter and summer. But perhaps mostly for summer, as baseline amounts are relatively low, and summer solar access is much improved over the winter low of only 45% insolation potential for December (caused by low incident angles, short day lengths, and considerable cloudiness).
